Median incomes have fallen for everyone, but they’ve fallen most for the lowest income households. New research finds that income inequality suppresses economic growth.
By Sharon Simonson
The middle-class is shrinking in hundreds of U.S. cities including the San Francisco-Oakland and San Jose-Sunnyvale metro areas, according to new Pew Research Center analysis encompassing three-quarters of the American population.
In the Bay Area metros, not only is the middle class shrinking but fewer than half of adults now live in middle-class households, a change in conditions from five years ago.
In addition, while more Bay Area adults joined the upper-income ranks, helping reduce the size of the middle class, median household incomes fell. The decline was greatest for lower-income households, where the median dropped 12 percent in both San Francisco-Oakland and San Jose-Sunnyvale to about $23,000 for a family of three. Upper-income households saw less than a 4 percent decline.
Nearly one in three adults in San Jose-Sunnyvale now live in upper-income households, one of only four metros in the study with an upper-income portion greater than 30 percent. In San Francisco-Oakland, 28 percent of adults live in upper-income households, up more than 4 percentage points since 2000.
Income inequality has been linked to slower and more unstable economic growth, according to 2014 research by the International Monetary Fund and others cited in the report. “(W)hat matters most is the gap between low income households and the rest of the population,” according to 2014 research by economist Federico Cingano of the Bank of Italy and the Organization for Economic Cooperation and Development, also cited.
Increased income gaps between the lowest-income and middle- and upper-income households also are associated with worse educational outcomes for the poor, in terms of both educational quality and the number of years spent in school, the Cingano research found.
Pew documented the middle-income contraction nationally in a December report that found the number of upper-income and lower-income adults combined (121.3 million) had overtaken the number of middle-income adults (120.8 million). In comparison, 80 million adults were considered middle-income or “middle-class,” in 1971, while fewer than 52 million were lower- and upper-income combined.
The current review looked at 229 individual metros comparing 2000 and 2014 census data to find that the middle class is contracting across U.S. urban centers. In more than a quarter of metros studied—50 in all—less than half of adults now live in middle-class households.
In both the San Jose and San Francisco metros, 48 percent of adults lived in middle-income households in 2014 compared to 53 percent in 2000. The portion of adults living in lower-income households rose in both metros by roughly 1 percentage point in the same time, to not quite one in four in San Francisco-Oakland and one in five in San Jose-Sunnyvale.
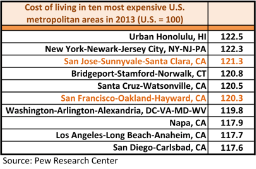
In making its determinations, Pew accounted for local cost of living and household size. Not surprisingly, the San Jose and San Francisco metros rank third- and sixth-most expensive places to live respectively among the areas studied. To be considered upper income a household of three must have annual income of not quite $125,000 or more. To be considered middle-income (or middle-class, the phrases are used interchangeably in the report) a household of three must have income of $42,000 or more. Below that threshold is considered lower-income.
Twenty percent of American adults are upper income; 29 percent are lower income, and the rest, 51 percent, are middle income, down from 55 percent in 2000.
Metropolitan areas with the largest upper-income populations are mostly in the Northeast or on the California coast in technology and financial centers. The adults in most upper-income areas are more likely to have college degrees than in the nation overall. Oil-rich Midland, Texas, an exception to the geographic trends, has the greatest share of upper-income adults in the country at 37 percent. Its upper income share grew by 18 percentage points in the period, shrinking both the middle class and the lower-income tiers.
Interesting